


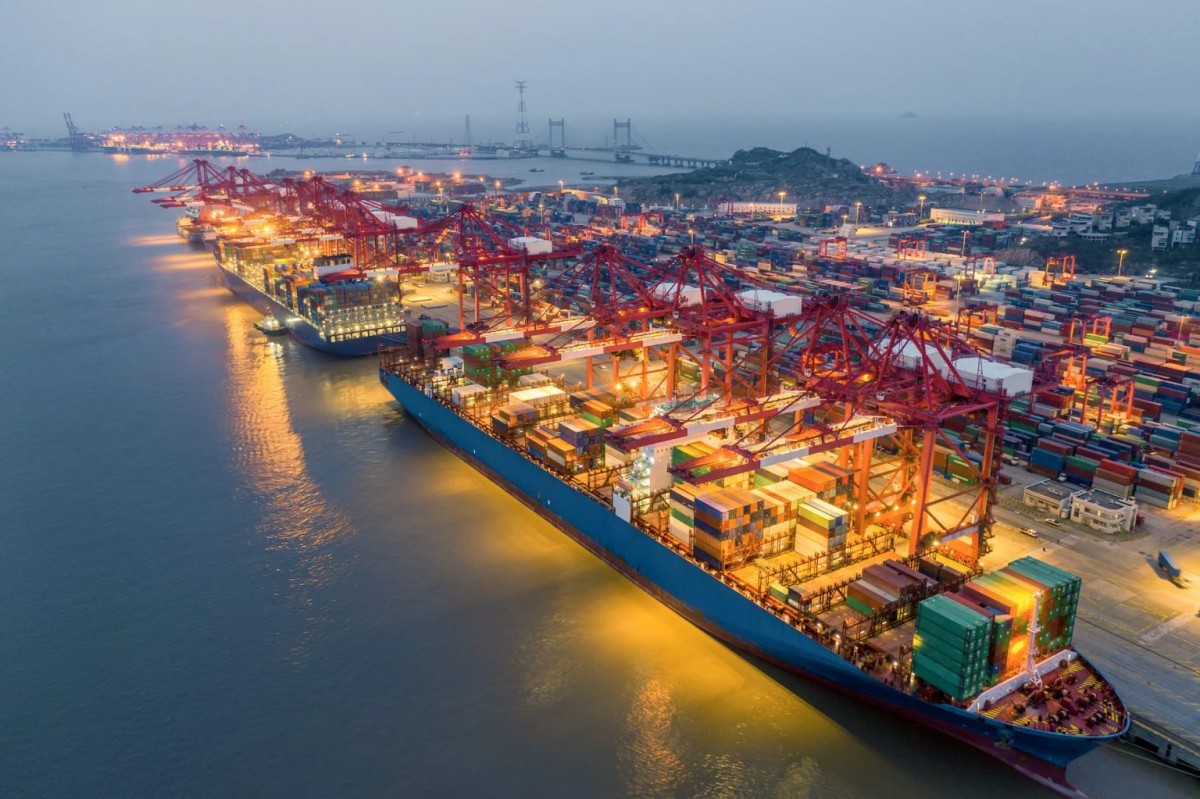
SINGAPORE : Global Container Port throughput crossed the 1 billion TEU mark for the first time in 2025, while faster growth outside the world’s largest gateways signalled a broader shift in where container volumes are being handled.
Worldwide throughput reached an estimated 1.012 billion TEU, up 8% from 937.3 million TEU in 2024, according to DynaLiners’ latest Millionaires report. The total stood at 876 million TEU in 2023.
The number of ports handling more than 1 million TEU rose to 171. Together, they processed about 884 million TEU, up 6% year on year. However, their share of global throughput slipped from 89% to 87% as ports outside the group expanded at a much faster pace.
Smaller gateways capture more growth
Ports handling less than 1 million TEU collectively processed 128.3 million TEU in 2025, a 21% increase from 106.4 million TEU a year earlier.
The figures suggest that container growth is becoming more widely distributed, even as the largest hubs retain the overwhelming majority of global volumes.
Twelve ports entered the million TEU group during the year: Aqaba, Baltimore, Dar es Salaam, Dong Nai/Phuoc An, El Sokhna, Gdynia, Huanghua, Manaus, Rio Grande, Tanjung Emas, Vizhinjam, and Wilhelmshaven. Montevideo was the only port to leave the group.
Of the 171 qualifying ports, 135 recorded growth, and 14 expanded by at least 25%. Thirty six reported lower volumes, with Haikou posting the steepest decline at 28%.
Regional growth was also uneven. Africa recorded the strongest increase at 12%, reaching 39.3 million TEU across its qualifying ports. Latin America grew 11% to 45.3 million TEU, while the Indian subcontinent advanced 10% to 35.3 million TEU.
Shanghai leads as Ningbo closes on Singapore
The Far East remained the dominant container handling region, with 63 million TEU plus ports processing 531.2 million TEU, up 6%.
Shanghai retained its position as the world’s largest container port, handling 55.06 million TEU, 7% more than in 2024.
Singapore remained second at 44.66 million TEU after 9% growth, but Ningbo narrowed the gap sharply. The Chinese port increased throughput by 12% to 43.87 million TEU, leaving less than 800,000 TEU between the two gateways.
Shenzhen ranked fourth at 35.41 million TEU, followed by Qingdao at 32.89 million TEU.
Nineteen ports exceeded 10 million TEU during 2025, underscoring the continued concentration of containerised trade among a relatively small group of major gateways.
China maintains commanding position
China remained the largest national market in the ranking. Its 30 million TEU plus ports handled 306.4 million TEU, up 6% from 287.8 million TEU in 2024.
The United States ranked second with 55.55 million TEU across 13 qualifying ports, an increase of 4%. Singapore followed with 44.66 million TEU, ahead of Malaysia at 31.6 million TEU and South Korea at 30.39 million TEU.
Vietnam’s four qualifying ports increased combined throughput by 11% to 25.88 million TEU, while India recorded 12% growth to almost 20 million TEU.
DynaLiners defines port throughput as full and empty containers loaded and discharged from ocean going short-sea, and deep-sea vessels, including imports, exports, and transshipment. Some figures are estimates, and differences in reporting periods and port definitions can affect comparisons.
Source : BBN Breakbulk News