India’s overall exports (merchandise + services) estimated to surpass last year’s highest record, hit 12-month high of $41.68 billion in March
NEW DELHI : India’s overall exports (Merchandise and Services combined) in March 2024* is estimated to be USD 70.21 Billion, exhibiting a negative growth of (-) 3.01 per cent over March 2023. Overall imports in March 2024* is estimated to be USD 73.12 Billion, exhibiting a negative growth of (-) 6.11 per cent over March 2023.
The sharp drop in India’s import bill during March was led by gold imports, which fell a sharp 53.6% in March to $1.53 billion, and aided by a drop in non-oil, non-gold imports. However, silver imports jumped nearly 1059% to $816.6 million.
March’s relatively strong export tally, coming on the back of a $41.4 billion figure in February, lifted the generally weak merchandise shipments tally for 2023-24 somewhat. While goods exports in the first ten months averaged $35.4 billion, the last two months’ spike lifted the full year export figure to $437.1 billion, 3.1% below the record $451.1 billion performance in the previous year.
Goods imports dropped by a sharper 5.41% to $677.24 billion in 2023-24, which helped moderate India’s trade deficit for the year to $240.2 billion, 9.33% lower than the preceding year.
While official numbers for Services exports are only available till February, the Commerce Ministry estimated that they shrank 6.2% in March to $28.5 billion, while imports dropped 6.6% to $15.8 billion. Despite last month’s contraction, overall services exports are estimated to have risen 4.4% in 2023-24 to nearly $340 billion, while imports dropped 2.5% to $177.6 billion, the ministry said.
India’s overall merchandise and services exports are thus, reckoned to have risen 0.04% in 2023-24 to $776.68 billion, while total imports are estimated at $854.8 billion, reflecting a 4.81% decline over 2022-23, the ministry said.
The easing of the goods trade deficit last month isexpected to augur well for the current account balance in the final quarter of 2023-24, said ICRA Chief Economist Aditi Nayar. “We may witness a small, transient surplus of about $1-2 billion in the quarter,” she reckoned.
Table 1: Trade during March 2024*
| March 2024(USD Billion) | March 2023(USD Billion) | ||
| Merchandise | Exports | 41.68 | 41.96 |
| Imports | 57.28 | 60.92 | |
| Services* | Exports | 28.54 | 30.44 |
| Imports | 15.84 | 16.96 | |
| Overall Trade(Merchandise +Services) * | Exports | 70.21 | 72.40 |
| Imports | 73.12 | 77.88 | |
| Trade Balance | -2.91 | -5.48 |
Fig 1: Overall Trade during March 2024*
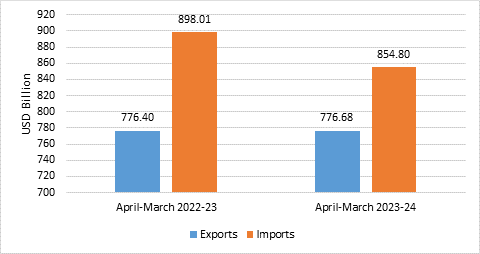
- India’s overall exports (Merchandise and Services combined) in FY 2023-24 (April-March)* are estimated to be USD 776.68 Billion, exhibiting a positive growth of 0.04 per cent over FY 2022-23 (April-March). Overall imports in FY 2023-24 (April-March)* are estimated to be USD 854.80 Billion, exhibiting a negative growth of (-) 4.81 per cent over FY 2022-23 (April-March).
Table 2: Trade during FY 2023-24 (April-March)*
| 2023-24(USD Billion) | 2022-23 (USD Billion) | ||
| Merchandise | Exports | 437.06 | 451.07 |
| Imports | 677.24 | 715.97 | |
| Services* | Exports | 339.62 | 325.33 |
| Imports | 177.56 | 182.05 | |
| Overall Trade(Merchandise+ Services)* | Exports | 776.68 | 776.40 |
| Imports | 854.80 | 898.01 | |
| Trade Balance | -78.12 | -121.62 |
Fig 2: Overall Trade during FY 2023-24 (April-March)*
MERCHANDISE TRADE
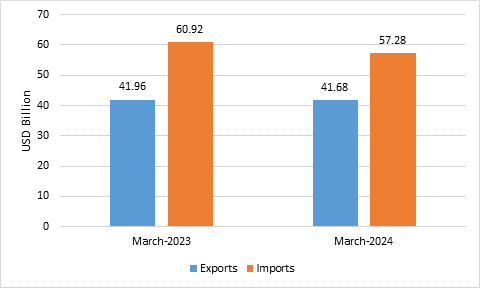
- Merchandise exports in March 2024 were USD 41.68 Billion, as compared to USD 41.96 Billion in March 2023.
- Merchandise imports in March 2024 were USD 57.28 Billion, as compared to USD 60.92 Billion in March 2023.
Fig 3: Merchandise Trade during March 2024
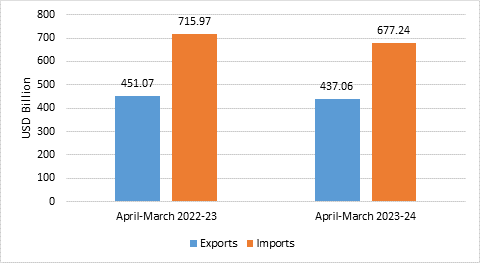
- Merchandise exports for the period FY 2023-24 (April-March) were USD 437.06 Billion as against USD 451.07 Billion during FY 2022-23 (April-March).
- Merchandise imports for the period FY 2023-24 (April-March) were USD 677.24 Billion as against USD 715.97 Billion during FY 2022-23 (April-March).
- The merchandise trade deficit for FY 2023-24 (April-March) was estimated at USD 240.17 Billion as against USD 264.90 Billion during FY 2022-23 (April-March).
Fig 4: Merchandise Trade during FY 2023-24 (April-March)
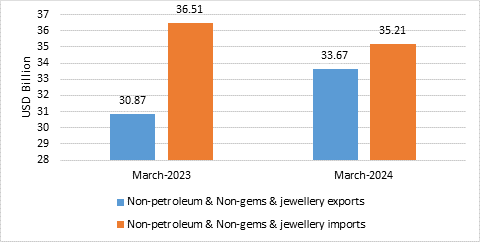
- Non-petroleum and non-gems & jewellery exports in March 2024 were USD 33.67 Billion, compared to USD 30.87 Billion in March 2023.
- Non-petroleum, non-gems & jewellery (gold, silver & precious metals) imports in March 2024 were USD 35.21 Billion, compared to USD 36.51 Billion in March 2023.
Table 3: Trade excluding Petroleum and Gems & Jewellery during March 2024
| March 2024(USD Billion) | March 2023(USD Billion) | |
| Non- petroleum exports | 36.29 | 33.61 |
| Non- petroleum imports | 40.05 | 42.90 |
| Non-petroleum & Non Gems & Jewellery exports | 33.67 | 30.87 |
| Non-petroleum & Non Gems & Jewellery imports | 35.21 | 36.51 |
Note: Gems & Jewellery Imports include Gold, Silver & Pearls, precious & Semi-precious stones
Fig 5: Trade excluding Petroleum and Gems & Jewellery during March 2024
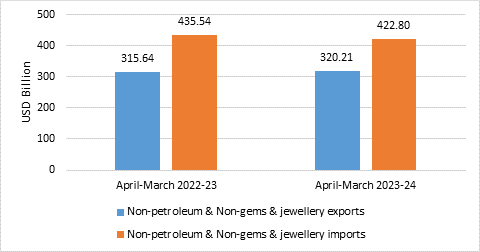
- Non-petroleum and non-gems & jewellery exports during FY 2023-24 (April-March) was USD 320.21 Billion, as compared to USD 315.64 Billion in FY 2022-23 (April-March).
- Non-petroleum, non-gems & jewellery (gold, silver & precious metals) imports were USD 422.80 Billion in FY 2023-24 (April-March) as compared to USD 435.54 Billion in FY 2022-23 (April-March).
Table 4: Trade excluding Petroleum and Gems & Jewellery during FY 2023-24 (April-March)
| 2023-24(USD Billion) | 2022-23 (USD Billion) | |
| Non- petroleum exports | 352.92 | 353.60 |
| Non- petroleum imports | 497.62 | 506.55 |
| Non-petroleum & Non Gems & Jewellery exports | 320.21 | 315.64 |
| Non-petroleum & Non Gems & Jewellery imports | 422.80 | 435.54 |
Note: Gems & Jewellery Imports include Gold, Silver & Pearls, precious & Semi-precious stones
Fig 6: Trade excluding Petroleum and Gems & Jewellery during FY 2023-24 (April-March)
SERVICES TRADE
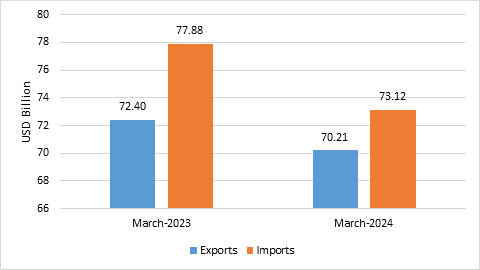
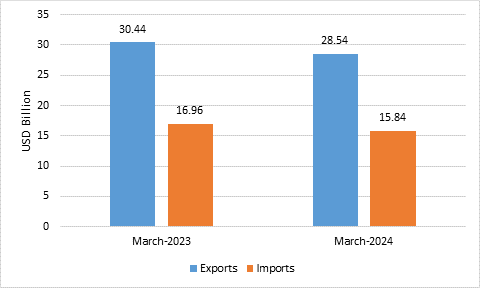
- The estimated value of services export for March 2024* is USD 28.54 Billion, as compared to USD 30.44 Billion in March 2023.
- The estimated value of services import for March 2024* is USD 15.84 Billion as compared to USD 16.96 Billion in March 2023.
Fig 7: Services Trade during March 2024*
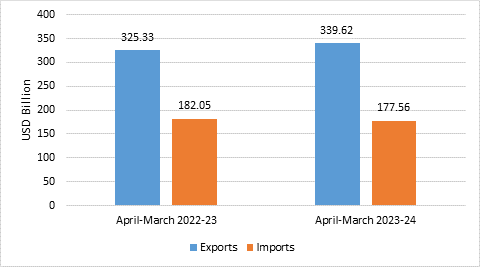
- The estimated value of services export for FY 2023-24 (April-March)* is USD 339.62 Billion as compared to USD 325.33 Billion in FY 2022-23 (April-March).
- The estimated value of services imports for FY 2023-24 (April-March)* is USD 177.56 Billion as compared to USD 182.05 Billion in FY 2022-23 (April-March).
- The services trade surplus for FY 2023-24 (April-March)* is estimated at USD 162.05 Billion as against USD 143.28 Billion in FY 2022-23 (April-March).
Fig 8: Services Trade during FY 2023-24 (April-March)*