
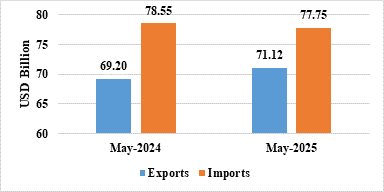
India’s export rose 2.77% in May at $71.12 billion; trade deficit narrowed
NEW DELHI : India’s total exports (Merchandise and Services combined) for May 2025* is estimated at US$ 71.12 Billion, registering a positive growth of 2.77 percent vis-à-vis May 2024. Total imports (Merchandise and Services combined) for May 2025* is estimated at US$ 77.75 Billion, registering a negative growth of (-) 1.02 percent vis-à-vis May 2024.
Fig 1: Total Trade during May 2025*
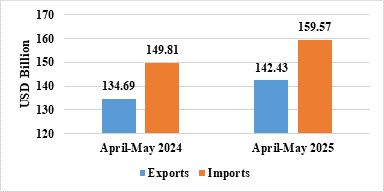
- India’s total exports during April-May 2025* is estimated at US$ 142.43 Billion registering a positive growth of 5.75 percent. Total imports during April-May 2025* is estimated at US$ 159.57 Billion registering a growth of 6.52 percent.
Fig 2: Total Trade during April-May 2025*
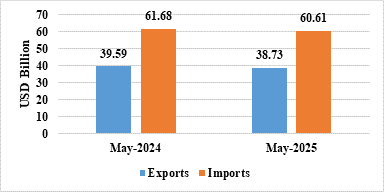
MERCHANDISE TRADE
- Merchandise exports during May 2025 were US$ 38.73 Billion as compared to US$ 39.59 Billion in May 2024.
- Merchandise imports during May 2025 were US$ 60.61 Billion as compared to US$ 61.68 Billion in May 2024.
Fig 3: Merchandise Trade during May 2025
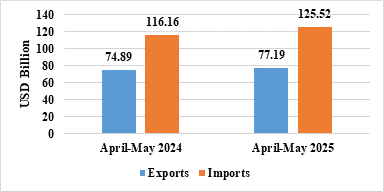
- Merchandise exports during April-May 2025 were US$ 77.19 Billion as compared to US$ 74.89 Billion during April-May 2024.
- Merchandise imports during April-May 2025 were US$ 125.52 Billion as compared to US$ 116.16 Billion during April-May 2024.
- Merchandise trade deficit during April-May 2025 was US$ 48.33 Billion as compared to US$ 41.27 Billion during April-May 2024.
Fig 4: Merchandise Trade during April-May 2025
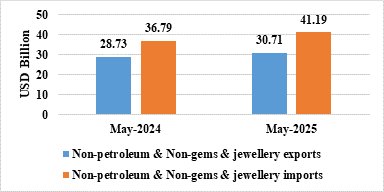
- Non-petroleum and non-gems & jewellery exports in May 2025 were US$ 30.71 Billion compared to US$ 28.73 Billion in May 2024.
- Non-petroleum, non-gems & jewellery (gold, silver & precious metals) imports in May 2025 were US$ 41.19 Billion compared to US$ 36.79 Billion in May 2024.
Table 3: Trade excluding Petroleum and Gems & Jewellery during May 2025
| May 2025(US$ Billion) | May 2024(US$ Billion) | |
| Non- petroleum exports | 33.09 | 31.49 |
| Non- petroleum imports | 45.86 | 41.70 |
| Non-petroleum & Non-Gems & Jewellery exports | 30.71 | 28.73 |
| Non-petroleum & Non-Gems & Jewellery imports | 41.19 | 36.79 |
Note: Gems & Jewellery Imports include Gold, Silver & Pearls, precious & Semi-precious stones
Fig 5: Trade excluding Petroleum and Gems & Jewellery during May 2025
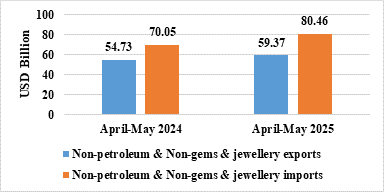
- Non-petroleum and non-gems & jewellery exports in April-May 2025 were US$ 59.37 Billion, compared to US$ 54.73 Billion in April-May 2024.
- Non-petroleum, non-gems & jewellery (gold, silver & precious metals) imports in April-May 2025 were US$ 80.46 Billion, compared to US$ 70.05 Billion in April-May 2024.
Table 4: Trade excluding Petroleum and Gems & Jewellery during April-May 2025
| April-May 2025(US$ Billion) | April-May 2024(US$ Billion) | |
| Non- petroleum exports | 64.25 | 59.75 |
| Non- petroleum imports | 90.06 | 79.70 |
| Non-petroleum & Non Gems & Jewellery exports | 59.37 | 54.73 |
| Non-petroleum & Non Gems & Jewellery imports | 80.46 | 70.05 |
Note: Gems & Jewellery Imports include Gold, Silver & Pearls, precious & Semi-precious stones
Fig 6: Trade excluding Petroleum and Gems & Jewellery during April-May 2025
SERVICES TRADE
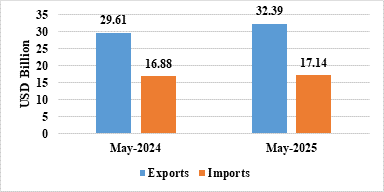
- The estimated value of services export for May 2025* is US$ 32.39 Billion as compared to US$ 29.61 Billion in May 2024.
- The estimated value of services imports for May 2025* is US$ 17.14 Billion as compared to US$ 16.88 Billion in May 2024.
Fig 7: Services Trade during May 2025*
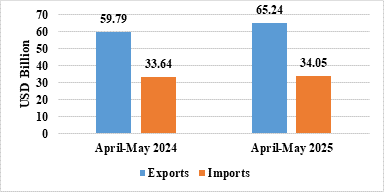
- The estimated value of service exports during April-May 2025* is US$ 65.24 Billion as compared to US$ 59.79 Billion in April-May 2024.
- The estimated value of service imports during April-May 2025* is US$ 34.05 Billion as compared to US$ 33.64 Billion in April-May 2024.
- The services trade surplus for April-May 2025* is US$ 31.19 Billion as compared to US$ 26.15 Billion in April-May 2024.
Fig 8: Services Trade during April-May 2025*
Exports of Electronic Goods (54.1%), Marine Products (26.79%), Tobacco (22.69%), Meat, Dairy & Poultry Products (16.87%), Organic & Inorganic Chemicals (16%), Mica, Coal & Other Ores, Minerals Including Processed Minerals (11.65%), Rmg Of All Textiles (11.35%), Spices (11.19%), Other Cereals (9.64%), Jute Mfg. Including Floor Covering (9.5%), Coffee (8.18%), Drugs & Pharmaceuticals (7.38%), Leather & Leather Products (6.89%), Fruits & Vegetables (2.56%), Tea (2.3%), Ceramic Products & Glassware (2.27%), Carpet (1%) record positive growth during May 2025 over the corresponding month of last year.
Imports of Pulses (-51.89%), Transport Equipment (-28.23%), Fertilisers, Crude & Manufactured (-26.64%), Petroleum, Crude & Products (-26.14%), Newsprint (-20.57%), Coal, Coke & Briquettes, Etc. (-19.37%), Pearls, Precious & Semi-Precious Stones (-18.51%), Metaliferrous Ores & Other Minerals (-13.53%), Gold (-12.6%), Vegetable Oil (-3.61%) record negative growth during May 2025 over the corresponding month of last year.
Services exports is estimated to grow by 9.11 percent during April-May 2025* over April-May 2024.
Top 5 export destinations, in terms of change in value, exhibiting positive growth in May 2025 vis a vis May 2024 are U S A (16.93%), China P Rp (25.04%), Australia (35.36%), Russia (48.11%), and Germany (17.05%).
Top 5 export destinations, in terms of change in value, exhibiting positive growth in April-May 2025 vis a vis April-May 2024 are U S A (21.78%), U Arab Emts (12.31%), Australia (50.76%), China P Rp (18.75%) and Oman (40.94%).
Top 5 import sources, in terms of change in value, exhibiting growth in May 2025 vis a vis May 2024 are China P Rp (21.61%), U Arab Emts (27.64%), Nigeria (89.56%), Hong Kong (29.3%), and Japan (24.32%).
Top 5 import sources, in terms of change in value, exhibiting growth in April-May 2025 vis a vis April-May 2024 are U Arab Emts (52.08%), China P Rp (24.23%), U S A (25.8%), Ireland (287.99%) and Hong Kong (38.5%).