Merchandise trade posts strong growth in Q1 ahead of tariff hikes : WTO
GENEVA : The new tariffs announced by the United States on 2 April at the start of the second quarter were widely anticipated, allowing importers to move purchases forward to avoid paying higher duties at a later date. Trade volume growth in the first quarter was above projections issued in the WTO’s Global Trade Outlook and Statistics report on 16 April, both for the Secretariat’s baseline forecast of 2.7% for 2025, which assumed a continuation of policies in place at the start of the year, and the adjusted forecast of ‑0.2% assuming policies in place on 16 April.
Since then, a variety of trade agreements and trade measures have nudged the adjusted forecast up and down slightly, but as of mid-June merchandise trade growth for the year was still expected to be basically flat at 0.1%.
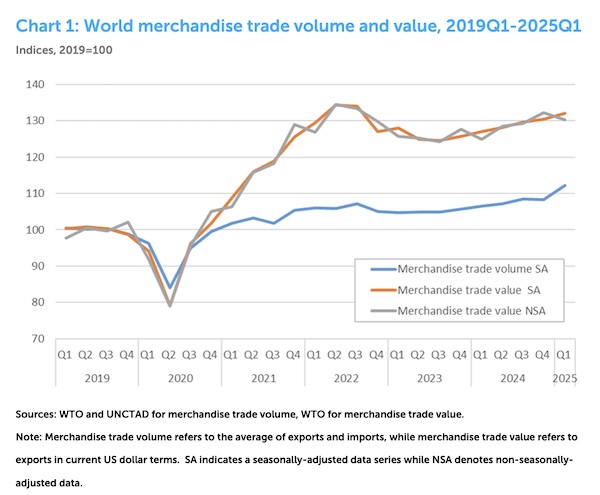
Meanwhile, the US dollar value of world merchandise trade — as measured by non-seasonally-adjusted exports — was up 4% year-on-year in the first quarter of 2025, reflecting strong growth in volume terms and declining prices (Chart 1). The value of trade in the first quarter was down compared to the previous quarter due to regular seasonal variation, but seasonally-adjusted figures continued to rise.
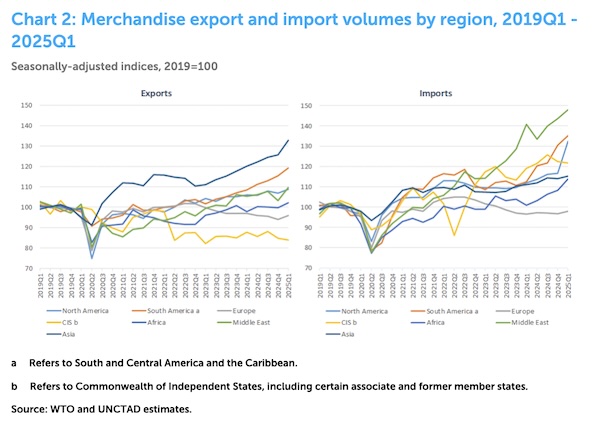
There were significant disparities across regions in merchandise trade volume growth in the first quarter, especially on the import side (Chart 2). North America recorded the strongest quarter-on-quarter import growth of any region by far at 13.4%, followed by Africa at 5.1%, South and Central America and the Caribbean at 3.6%, the Middle East at 3.0%, Europe at 1.3%, and Asia at 1.1%. The Commonwealth of Independent States (CIS), including certain associate and former member states, was the only region to record a decline in the first quarter at -0.5%. On the export side, the Middle East recorded the strongest quarter-on-quarter growth at 6.3%, followed by Asia at 5.6%, South America at 3.2%, Africa at 2.5%, Europe at 1.9% and North America at 1.8%. The CIS region also registered an export decline of -1.0% in the first quarter.
Merchandise trade developments in value terms during the first quarter of 2025
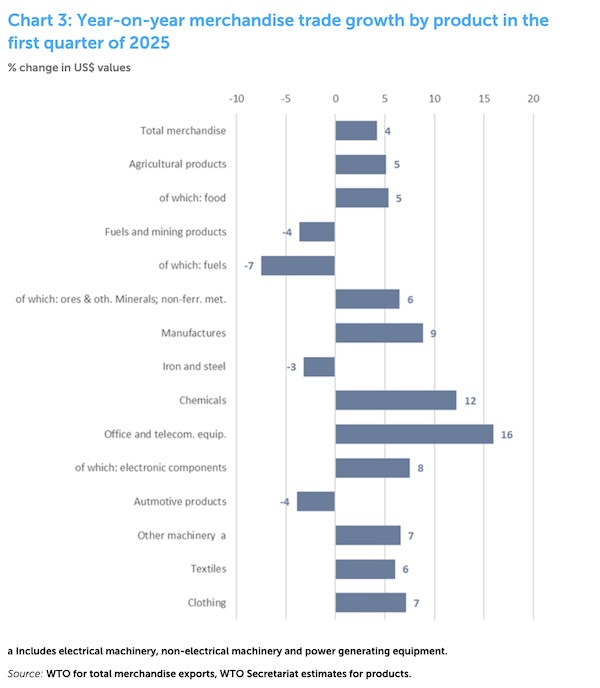
Chart 3 shows year-on-year growth in the US dollar value of world merchandise trade by broad product category in the first quarter.1 The strongest performance was in office and telecom equipment (+16% year-on-year), followed by chemicals (+12%) and clothing (+7%). Among the product categories shown, only automotive products (-4%), fuels and mining products (-4%; of which: fuels -7%) and iron and steel (-3%) decreased in value terms. While fuel prices changed little compared with the same quarter in the previous year, prices for metals and minerals (excluding gold & silver) were 8% higher.
Africa had the strongest merchandise export growth of any region in value terms in the first quarter, up 9% year-on-year (Chart 4). The increase was led by gold, ores, cocoa, and copper, while fuel shipments declined. It was followed by Asia (up 5%, led by precious metals and machinery) and South and Central America (up 4%, with increases in precious metals, ores and coffee/tea, and declines in fuels, oil seeds, and cereals). Among WTO regions, only the Commonwealth of Independent States (CIS)2 saw its exports decline (-6%).
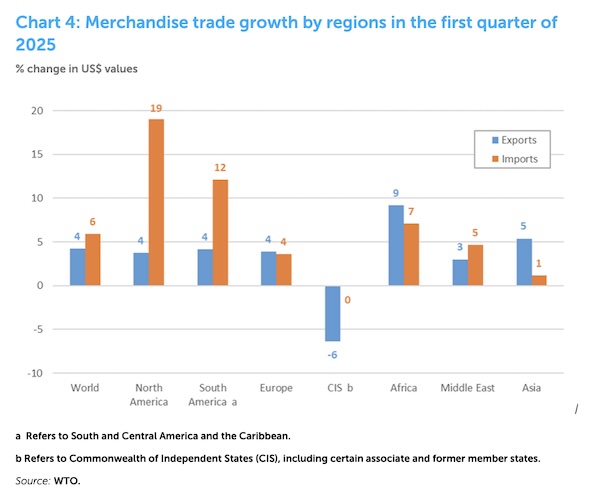
On the import side, strong year-on-year increases were observed in North America (+19%) and South America (+12%). Regarding North America, imports of machinery, precious metals and pharmaceuticals showed marked increases, while vehicle imports dropped slightly. South America saw particularly strong imports of machinery, articles of iron and steel, and vehicles, while imports of fuel fell. Asia’s first quarter merchandise imports increased the least amongst the regions (1%), apart from the 0.1% decline in the CIS region. Asia saw strong import growth for gold and iron ore while imports of vehicles fell. In line with the world trend, Asian imports of fuels also declined year-on-year, while imports of integrated circuits rose.
Monthly merchandise trade developments
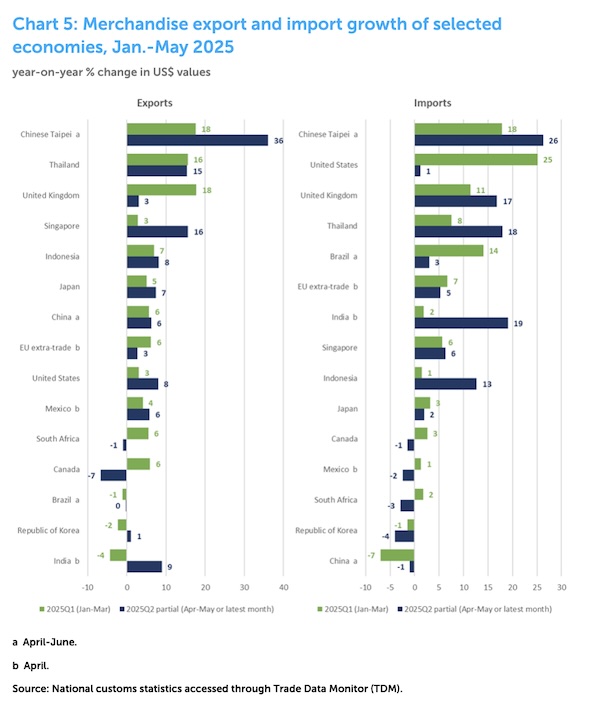
Monthly merchandise trade statistics in value terms are available for many countries into the second quarter of 2025. These data show evidence of import demand starting to slow after the first quarter surge. This is illustrated by Chart 5, which shows year-on-year growth in the US dollar value of merchandise exports and imports in 2025 for selected economies in the first quarter, plus partial data for the second quarter (April-May or the latest available month).
For example, imports of the United States were up 25% in the first quarter but only 1% in the first two months of the second quarter. For the year to date (Jan-May), US imports were up 15%. On the export side, shipments from China were up 6% year-on-year in both Q1 and Q2, but other Asian economies saw export growth accelerate (e.g. India, down 4% year-on-year in Q1 but up 9% in April).
Source: World Trade Organization