
India’s exports (Merchandise & Services) during April-February 2024-25 registers an estimated growth of 6.24%
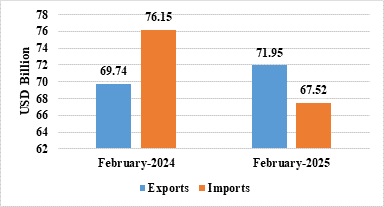
NEW DELHI : India’s total exports (Merchandise and Services combined) for February 2025* is estimated at USD 71.95 Billion, registering a positive growth of 3.16 percent vis-à-vis February 2024. Total imports (Merchandise and Services combined) for February 2025* is estimated at USD 67.52 Billion, registering a negative growth of (-)11.34 percent vis-à-vis February2024.

Table 1: Trade during February2025*
February2025 February2024
(USD Billion) (USD Billion)
Merchandise Exports 36.91 41.41
Imports 50.96 60.92
Services* Exports 35.03 28.33
Imports 16.55 15.23
Total Trade Exports 71.95 69.74
(Merchandise +Services) * Imports 67.52 76.15
Trade Balance 4.43 -6.41
Note: The latest data for services sector released by RBI is for January2025. The data for February2025 is an estimation, which will be revised based on RBI’s subsequent release. (ii) Data for April-February2023-24 and April-September2024 has been revised on pro-rata basis using quarterly balance of payments data.
Fig 1: Total Trade during February2025*
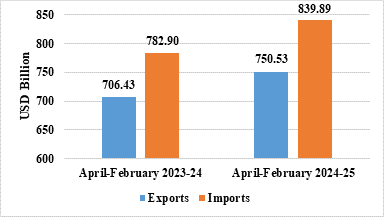
- India’s total exports during April-February 2024-25* is estimated at USD 750.53 Billion registering a positive growth of 6.24 percent. Total imports during April-February 2024-25* is estimated at USD 839.89 Billion registering a growth of 7.28 percent.
Table 2: Trade during April-February2024-25*
April-February 2024-25 April-February 2023-24
(USD Billion) (USD Billion)
Merchandise Exports 395.63 395.38
Imports 656.68 621.19
Services* Exports 354.90 311.05
Imports 183.21 161.71
Total Trade Exports 750.53 706.43
(Merchandise +Services) * Imports 839.89 782.90
Trade Balance -89.37 -76.47
Fig 2: Total Trade during April-February2024-25*
MERCHANDISE TRADE
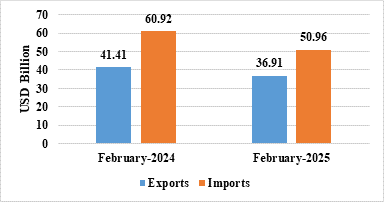
- Merchandise exports during February2025 were USD 36.91 Billion as compared to USD 41.41 Billion in February2024.
- Merchandise imports during February2025 were USD 50.96 Billion as compared to USD 60.92 Billion in February2024.
Fig 3: Merchandise Trade during February2025
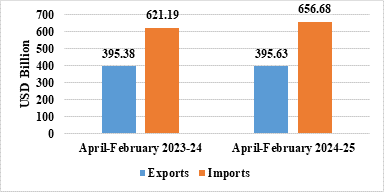
- Merchandise exports during April-February 2024-25 were USD 395.63 Billion as compared to USD 395.38 Billion during April-February 2023-24.
- Merchandise imports during April-February 2024-25 were USD 656.68 Billion as compared to USD 621.19 Billion during April-February 2023-24.
- Merchandise trade deficit during April-February 2024-25 was USD 261.06 Billion as compared to USD 225.81 Billion during April-February 2023-24.
Fig4: Merchandise Trade during April-February2024-25
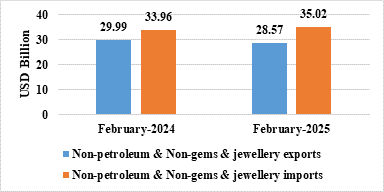
- Non-petroleum and non-gems & jewellery exports in February 2025 were USD 28.57Billion compared to USD 29.99 Billion in February 2024.
- Non-petroleum, non-gems & jewellery (gold, silver & precious metals) imports in February 2025 were USD 35.02 Billion compared to USD 33.96 Billion in February 2024.
Table 3: Trade excluding Petroleum and Gems & Jewellery during February2025
| February 2025 (USD Billion) | February 2024 (USD Billion) | |
| Non- petroleum exports | 31.10 | 33.19 |
| Non- petroleum imports | 39.07 | 44.03 |
| Non-petroleum & Non-Gems & Jewellery exports | 28.57 | 29.99 |
| Non-petroleum & Non-Gems & Jewellery imports | 35.02 | 33.96 |
Note: Gems & Jewellery Imports include Gold, Silver & Pearls, precious & Semi-precious stones
Fig 5: Trade excluding Petroleum and Gems & Jewellery during February2025
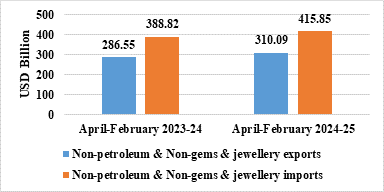
- Non-petroleum and non-gems & jewellery exports in April-February 2024-25 were USD 310.09 Billion, compared to USD 286.55 Billion in April-February2023-24.
- Non-petroleum, non-gems & jewellery (gold, silver & precious metals) imports in April-February 2024-25 were USD 415.85 Billion, compared to USD 388.82 Billion in April-February2023-24.
Table 4: Trade excluding Petroleum and Gems & Jewellery during April-February2024-25
| April-February 2024-25 (USD Billion) | April-February 2023-24 (USD Billion) | |
| Non- petroleum exports | 337.01 | 316.64 |
| Non- petroleum imports | 489.96 | 458.80 |
| Non-petroleum &Non Gems& Jewellery exports | 310.09 | 286.55 |
| Non-petroleum & Non Gems & Jewellery imports | 415.85 | 388.82 |
Note: Gems & Jewellery Imports include Gold, Silver & Pearls, precious & Semi-precious stones
Fig 6: Trade excluding Petroleum and Gems & Jewellery during April-February 2024-25
SERVICES TRADE
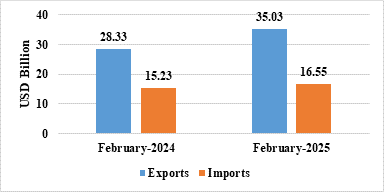
- The estimated value of services export for February2025* is USD 35.03 Billion as compared to USD 28.33 Billion in February 2024.
- The estimated value of services imports for February2025* is USD 16.55 Billion as compared to USD 15.23 Billion in February 2024.
Fig 7: Services Trade during February2025*
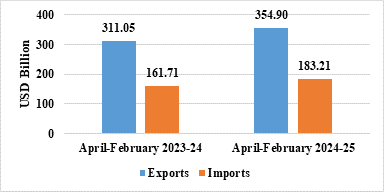
- The estimated value of service exports during April-February2024-25* is USD 354.90 Billion as compared to USD 311.05 Billion in April-February 2023-24.
- The estimated value of service imports during April-February2024-25* is USD 183.21 Billion as compared to USD 161.71 Billion in April-February 2023-24.
- The services trade surplus for April-February 2024-25* is USD 171.69 Billion as compared to USD 149.34 Billion in April-February 2023-24.
Fig 8: Services Trade during April-February2024-25*
- Exports of Tobacco (26.76%), Electronic Goods (26.46%), Mica, Coal & Other Ores, Minerals Including Processed Minerals (24.25%), Coffee (22.32%), Rice (13.21%), Jute Mfg. Including Floor Covering (12.41%), Other Cereals (11.65%), Meat, Dairy & Poultry Products (6.7%), Carpet (4.87%), Rmg Of All Textiles (3.97%), Marine Products (3.4%), Spices (0.98%) and Fruits & Vegetables (0.87%) record positive growth during February2025 over the corresponding month of last year.
- Imports of Silver (-75.04%), Gold (-61.98%), Pearls, Precious & Semi-Precious Stones (-41.61%), Coal, Coke & Briquettes, Etc. (-35.63%), Petroleum, Crude & Products (-29.59%), Iron & Steel (-23.37%), Transport Equipment (-16.93%), Newsprint (-12.43%), Artificial Resins, Plastic Materials, Etc. (-6.21%), Professional Instrument, Optical Goods, Etc. (-5.01%), Machine Tools (-3.68%), Fruits & Vegetables (-0.93%) record negative growth during February2025 over the corresponding month of last year.
- Services exports is estimated to grow by 14.10 percent during April-February 2024-25* over April-February 2023-24.
- Top 5 export destinations, in terms of change in value, exhibiting positive growth in February 2025 vis a vis February 2024 are U S A (10.37%), Australia (76.19%), Japan (26.55%), Brazil (10.85%) and Nigeria (10.75%).
- Top 5 export destinations, in terms of change in value, exhibiting positive growth in April-February 2024-25 vis a vis April-February 2023-24 are U S A (9.1%), U Arab Emts (5.19%), U K (12.47%), Japan (21.67%) and Netherland (3.68%).
- Top 5 import sources, in terms of change in value, exhibiting growth in February 2025 vis a vis February 2024 are Thailand (145.45%), China P Rp (7.83%), Brazil (162.18%), Ireland (117.17%) and Oman (30.24%).
- Top 5 import sources, in terms of change in value, exhibiting growth in April-February 2024-25 vis a vis April-February 2023-24 are U Arab Emts (29.21%), China P Rp (10.41%), Thailand (42.4%), U S A (7.23%) and Russia (4.9%).