

Middle East Conflict: Straits of Hormuz Transits remain 95% Down
LONDON: Clarksons Research, the data and analytics arm of the Clarksons Group have been closely monitoring shipping activity and markets impacted by the conflict. Summarising their latest update issued on Monday at 10.00 am 16th March, Steve Gordon, Global Head of Clarksons Research commented :
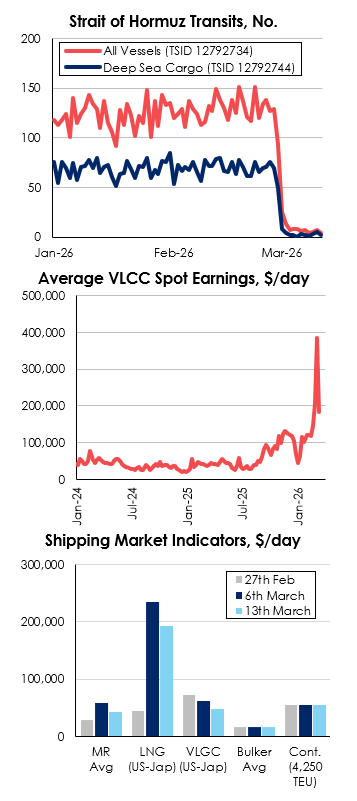
- Strait of Hormuz transits down 95% on pre-conflict levels (av. 5 transits per day past week vs ~125 pre-conflict).
- 80% of transits have been exiting the Gulf in the past week.
- Just 3 oil tankers with ~2m bbl capacity passed through the Strait across the weekend (vs 40 tankers over a typical two-day period), alongside 2 Indian-linked VLGCs while no LNG carriers have passed through the Strait in March.
- Excluding locally trading vessels, there are ~1,100 ships (37m GT of $30bn) currently inside the Gulf. This total features ~250 oil tankers, including 5% of crude tanker (7% of VLCCs) and 3% of product tanker tonnage as well as 4% of VLGC and 1% of containership and bulker tonnage.
- Some alternatives to Strait of Hormuz developing: VLCCs en-route to Yanbu on Red Sea up sixfold, IEA’s 400m bbl stock release draw has begun in Asia
- Charter rates for tanker and gas carriers eased through last week, though generally remained very elevated. Average VLCC earnings stood at $185,000/day (x5 long-term averages) on Friday, while LNG carrier spot rates stood at a firm $135,000/day (+45% vs long-term trend) and VLGC earnings on the US-Japan route eased w-o-w but showed resilience at $48,305/day (-7% vs 10-yr avg.). Bulker and container markets have seen more limited impacts for now.
- The cost of moving a barrel of crude oil remains elevated at $10/bbl (on a US Gulf – Asia voyage), up from $5/bbl at the start of the year.
- Container freight rates have moved higher, though on mainlane routes remain at moderate levels with gains largely reflecting recent increases in bunker prices; the SCFI rate on the Shanghai to North Europe route rose 11% last week to $1,618/TEU, in line with the 2025 average and remaining well down from previous peaks of almost $8,000/TEU at the height of Covid-related congestion and disruption in 2021, and around $5,000/TEU in mid-2024 as the impact of Red-Sea re-routing built.
- High bunker prices (e.g. VLSFO in Singapore stood at ~$1,100/t, +160% vs start-26) amid oil supply shortages is also starting to impact shipping markets – our data suggests that average container and bulkcarrier vessel speeds are down 2% across March so far.
- Prior to the conflict, 20% of global oil supply passed through the Strait of Hormuz, including 37% / 19% of seaborne crude oil and products trade. 19% of global LNG trade (3% of global natural gas supply) also passed through the Strait, alongside 28% of global LPG volumes (~10% of supply), as well as 13% of seaborne chemicals, 9% of cars, 4% of dry bulk and 3% of container trade volumes.
More detail from the latest update from Clarksons Research can be found below along with the graphics attached (underling data available on request).
Middle East Conflict: Update No. 6
By Stephen Gordon
The second week of the conflict has seen Strait of Hormuz vessel traffic remain very limited, further attacks on vessels and maritime infrastructure, accelerating impacts on oil production, volatility in energy prices and some easing in vessel charter rates. With mixed scenarios ahead for shipping markets depending on the duration of conflict, we again take stock in this weeks Analysis, while the full update, including a wider range of data points is available here.
Attacks & Transits
The 2nd week of the conflict has seen continued acute operational stress and disruption for the shipping industry, with reported attacks on vessels now totalling 18 (as at 16/3/26) and further attacks on ports (e.g. Fujairah) and refineries (e.g. 837,000 bpd Ruwais complex).
Exact transit levels through the Strait of Hormuz are uncertain (we have adapted our methodology) but remain very limited (down 95%, averaging 5 per day this week vs 125 pre-conflict – see p.4). Most tanker transits (avg. ~1 per day vs ~40 normally) were by ‘non-mainstream’ ships, while 80% of all transits have been exiting the Gulf. Reports of transits by specific flagged tonnage (e.g. India) have not materially impacted transit levels yet, and no military convoys have been launched.
Energy Markets
Oil markets have seen extreme volatility ($120/bbl to $85/bbl,) with sensitivity both to announcements aiming to reassure energy markets or to news of deepening disruption (e.g. with storage capacity ‘filling up’, production at major oil and gas fields (e.g. Zuluf, Safaniya) has been suspended and ~10m bpd of oil output is now offline).
While Iranian volumes (2m bpd) have continued through the Strait alongside flows out of Fujairah (U.A.E., ~1m bpd) and Oman (1m bpd), alternatives for the 15m bpd of crude normally flowing via Hormuz are also emerging, mainly out of Yanbu (extra volumes of 3-4m bpd could be seen – VLCCs enroute have increased sixfold). Even with these alternatives, the drop in global oil supply is the largest ever recorded (though the Middle East accounts for a lower share of global oil (31%) today vs 1973 (38%) when oil reached an inflation-adjusted $160/bbl).
Additional supportive, but temporary, measures, are also impacting energy (and shipping) markets e.g. the IEA’s 400m bbl stock draw (monitor rate of release and if used domestically, e.g. Japan), the US’s sanctions waiver on Russian oil on the water (~125m bbl of crude) extending from India to all countries and potential US Jones Act waiver (may support tanker demand e.g. US Gulf to US West Coast using SPR release). Downstream pressures are also building, especially in Asia (e.g. bunker prices have reached record highs – VLSFO at Singapore: >$1,100/t, +160% vs start-26) that will hit energy demand and heighten macro-economic risk.
Shipping Markets
The nature and duration of the conflict remain key for shipping and energy markets.
Tanker markets eased w-o-w on 13th March but remain elevated (e.g. VLCC $185,000/day, MR $43,000/day). A conflict of weeks rather than months may continue to offer supportive disruption factors (e.g. convoys add voyage duration time) albeit loss of seaborne volumes would eventually “catch up” with the market (despite Atlantic exports to Asia being longer haul). A slow-down in tanker S&P reflects the building uncertainties.
LNG spot rates also remain elevated ($135,000/day though ‘watch out’ for Qatari re-lets), while LPG carrier markets have shown ‘resilience’ but may also be impacted eventually by loss of volumes.
Bulker market impacts, more limited overall so far, may see higher coal trade from a longer conflict but may also be impacted by a weaker economy.
Impacts for container charter and freight rates seem generally positive with potential congestion and continued Red Sea re-routing (though inflation pressures may dent consumer demand in a longer conflict).
Mixed impacts across shipping segments and lots to digest.
Shipping Intelligence Network (SIN) is Clarkson Research’s market leading digital platform and the most comprehensive source of data on shipping and trade. The system provides immediate access to uniquely powerful data and analysis tracking and projecting market supply / demand, freight, vessel earnings, vessel values and macro-economic data around trade flows and global economic developments.
About Clarksons Research
Clarksons Research, the data and analytics arm of Clarksons, are the market leaders in the provision of independent data and intelligence around shipping, trade, offshore and the maritime energy transition. Millions of data points are processed and analysed each day to provide trusted and insightful intelligence to thousands of stakeholders across maritime. Better data for better decisions.