The importance of nuance in a volatile ocean container shipping market – shippers need a deeper dive into the data : Xeneta
OSLO : Making sense of ocean container shipping volatility in 2024 is no easy task, so it may be tempting for industry commentators to lean on headline figures or simplify complex market dynamics.
Any oversimplification of such a multi-faceted market does little to support businesses who need data and market analysis specific to their unique supply chain needs.
This latest Xeneta update will highlight some of the important nuances at play in the market.
Spot rates
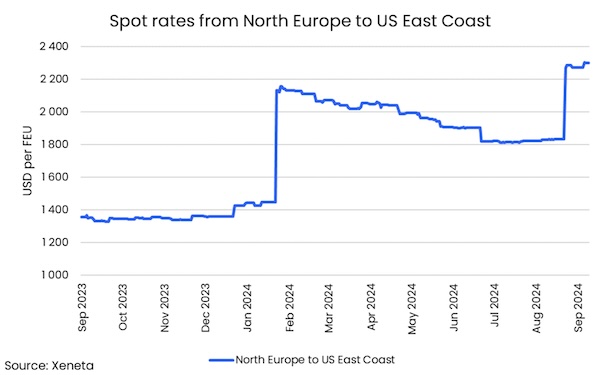
Spot rates have been softening on the major fronthaul trades from the Far East to the US and Europe since peaking in July.
These are the most important trades at a global level, but it would be a mistake to believe this trend is replicated across the entire market.
For example, rather than softening, average spot rates on the Transatlantic trade have increased 26% since 1 July to stand at USD 2300 per FEU.
The Transatlantic has historically lagged behind market movements on other major trades – meaning this data is vital for a shipper to understand how it may develop in the coming months.
Another key nuance is found in the orders of magnitude of freight rate developments. For example, a spot rate decrease of 1.4% on the US East Coast to Mediterranean trade since 1 July is of great importance to shippers who utilize this lane, but pales in comparison to the decreases seen on the Far East fronthauls.
Available capacity
Understanding why trades develop to different timelines also requires a deeper dive into the data.
For example, the US West Coast share of total imports from the Far East has increased in 2024, yet, perhaps counterintuitively, spot rates have fallen faster into the West Coast than into the East Coast since 1 July.
One reason for this may lie in the capacity being offered by carriers. In the week of 8 July, capacity from the Far East to US West Coast (352 000 TEU) exceeded the all-time-record of 350 700 TEU set during the pandemic on 11 October 2020.
With some shippers choosing to switch imports to the US West Coast from the US East Coast during 2024, understanding why freight rates are moving to different timelines and orders of magnitude on these trades is imperative.
Shippers also need to know if their containers will arrive on time, as well as how much it will cost to move them.
For example, service reliability from the Far East to US West coast is up 25 percentage points compared to July last year at 67.4%. With service reliability into the US East Coast remaining flat year-on-year at 39%, it becomes less surprising to see more shippers choosing to import into the US West Coast.
Long term market
The Xeneta Global XSI®, which measures all valid long term contracts in the market, increased 5% in August to stand at 159.0 points.
This was driven largely by the Far East Exports XSI® sub-index, which increased 10.7% to stand at 197.9 points.
Note: the latest XSI® data for September will be released next week at Xeneta.com.
This is a significant market development because the Global XSI® remained relatively flat during 2024, increasing by just 2.5% between January and July, while at the same time short term rates on the fronthauls out of the Far East were spiralling by upwards of 200%.
Without downplaying the importance of this development on the long term market at a global level, shippers need a deeper understanding of data to understand how the volatility of 2024 impacts their business at a port-to-port level.
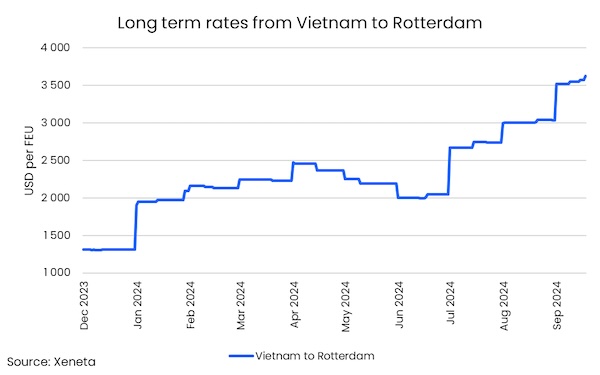
If you are a shipper who imports goods from Vietnam to Rotterdam, you would probably disagree with the suggestion that the long term market has remained relatively flat throughout 2024 before beginning to rise in July.
In fact, the long term contract market on this trade saw its first significant increase back in January with further increases at the start February and April. Then, following a subsequent softening of rates during Q2, the market has been increasing since the start of July.
Note: this data is based on long term rates signed within the past three months rather than all valid contracts in the market. This measure provides insight into the long term rates being offered at that particular point in time.
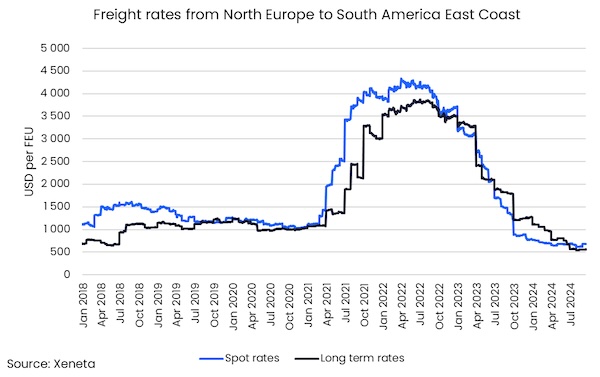
To reinforce the importance of nuance, when looking at the trade from North Europe to South America East Coast, there has not been a massive spike in spot rates during 2024 and the long term contract market has also been steadily softening.
On 1 August, both the long and short term rates on this trade plummeted to historic lows of USD 535 per FEU and USD 610 per FEU respectively, meaning a shipper on this lane would not recognize the spiralling markets seen on many other major world trades.
Carrier profits
Q2 has seen the world’s major ocean container carriers post big operating profits, but, once again, market nuance comes into play.
For example, Maersk Ocean moved from a loss of USD 161 million in Q1 to a positive USD 470m in Q2. Meanwhile, Hapag-Lloyd also saw an improvement in Q2 with an EBIT of USD 485 million.
However, market dynamics impact carriers in different ways and the positive financial results of Maersk Ocean and Hapag-Lloyd in Q2 are outdone by the large Asian carriers, such as Evergreen which posted operating profits of around USD 1 billion.
One of the reasons for this nuance in carrier profits is found in the fact Asian carriers have a higher exposure to Far East export trades – and it is on these trades where the biggest increases in freight rates are found in 2024.
Looking ahead
Shippers face a challenging time ahead and reading the market will not be easy. Before entering negotiations for new long term contracts they will need to have a deep understanding of market movements on their chosen port-to-port trades and how they may develop to different timelines.
Shippers should also be benchmarking against individual carriers on their chosen trades in the knowledge they too are impacted by market dynamics in different ways. This will become even more complicated in 2025 with the formation of new Alliances and the various service level promises on offer.
These are only a few examples of the market nuances that come into play, with shippers needing to balance many factors, which also include carbon emissions regulations, schedule reliability, equipment types (FEU, TEU and reefer) and the threat of further disruptions such as strikes on the US East Coast and Gulf Coast.
Without having access to data specific to individual supply chains, navigating these challenges with any degree of confidence is a thankless task.