Container congestion registered in every corner of the planet
COPENHAGEN : The state of global container congestion continues to roil supply chains right across the world.
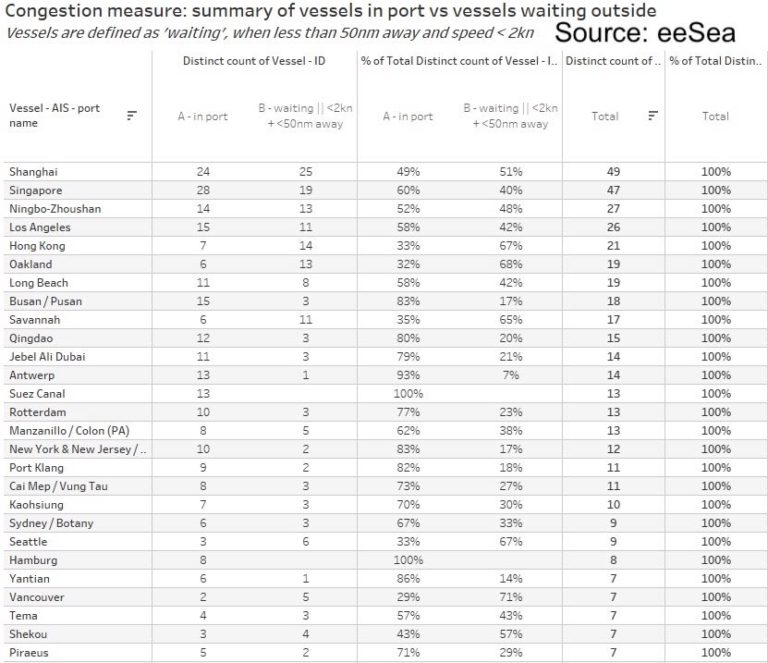
Exclusive data from maritime intelligence service eeSea shows the world’s most congested box spots, ranking all ports by the sum of mainline vessels either in port or waiting. The ratio between in port and waiting is an approximation of the congestion. Hong Kong, for example, has a high waiting ratio of 67%. Oakland, Savannah, Seattle, Vancouver are all above 65%, while Yantian, the scene of a Covid-19 outbreak that hampered productivity throughout June, has done well to clear much of its backlog over the past couple of weeks.
The data is based purely on AIS and covers mainliners, not feeders, something eeSea may add as a function at a later date.
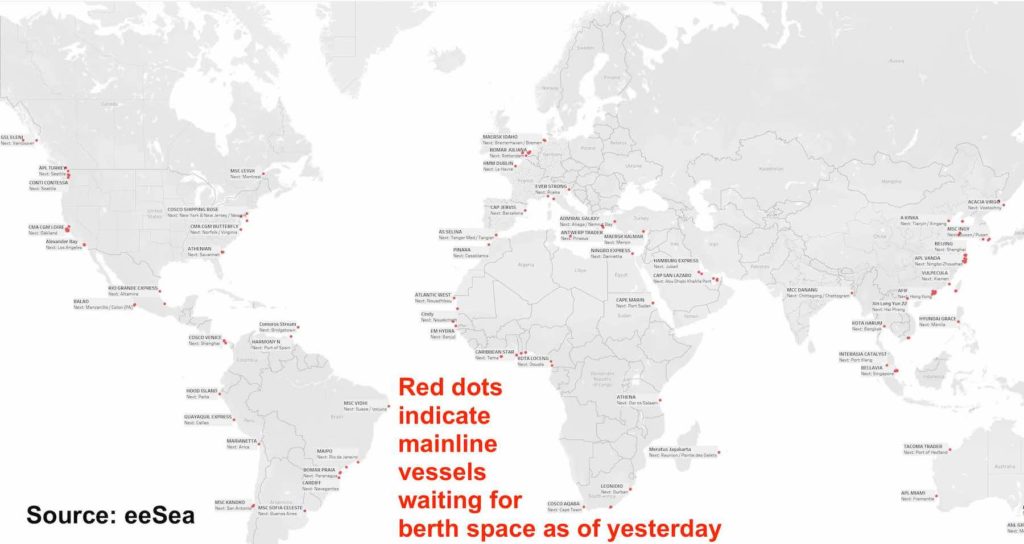
“While feeders do contribute to congestion, they’re usually considered a consequence, not a contributing factor,” explained Simon Sundboell, eeSea’s founder.
Extreme consumer demand, principally in the US, has combined with Covid-19 shipping and port dislocations all year, creating unprecedented congestion across the globe as well as record freight rates and all-time lows for liner schedule reliability.
Lars Jensen, founder of container consultancy Vespucci Maritime, has estimated that 10% of the world’s shipping capacity has been taken out due to port congestion issues.
Source : Splash247.com