
Exports decline by 12.2% to $34.48 billion in December, trade deficit at $23.76 billion
NEW DELHI : India’s merchandise exports declined by 12.2 percent to $34.48 billion in December 2022, as against $39.27 billion recorded in the same month of the preceding year, as per the government data shared on January 16. This comes after a 0.6 percent rise in exports in November and a 12 percent contraction in October.
India’s overall exports (Merchandise and Services combined) in April-December 2022 is estimated to exhibit a positive growth of 16.11 per cent over the same period last year (April-December 2021). As India’s domestic demand has remained steady amidst the global slump, overall imports in April-December 2022 is estimated to exhibit a growth of 25.55 per cent over the same period last year.
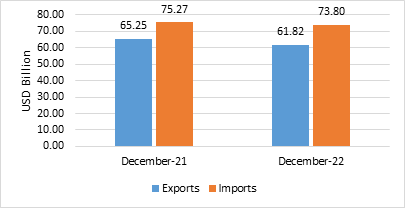
India’s overall export (Merchandise and Services combined) of USD 61.82 Billion in December 2022. The exports exhibited a negative growth of (-) 5.26 per cent over the same period last year. Overall import in December 2022* is estimated to be USD 73.80 Billion, exhibiting a negative growth of (-) 1.95 per cent over the same period last year.
Table 1: Trade during December 2022*
| December 2022(USD Billion) | December 2021(USD Billion) | ||
| Merchandise | Exports | 34.48 | 39.27 |
| Imports | 58.24 | 60.33 | |
| Services* | Exports | 27.34 | 25.98 |
| Imports | 15.56 | 14.94 | |
| Overall Trade(Merchandise +Services) * | Exports | 61.82 | 65.25 |
| Imports | 73.80 | 75.27 | |
| Trade Balance | -11.98 | -10.02 |
* Note: The latest data for services sector released by RBI is for November 2022. The data for December 2022 is an estimation, which will be revised based on RBI’s subsequent release. (ii) Data for April-December2021 and April-September 2022 has been revised on pro-rata basis using quarterly balance of payments data.
Fig 1: Overall Trade during December 2022*
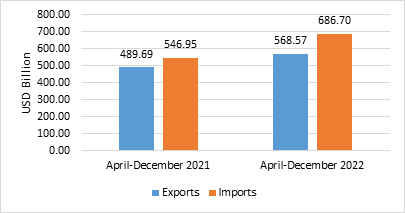
- India’s overall exports (Merchandise and Services combined) in April-December 2022* are estimated to be USD 568.57 Billion. Overall imports in April-December 2022* are estimated to be USD 686.70 Billion
Table 2: Trade during April-December 2022*
| April-December 2022(USD Billion) | April-December 2021(USD Billion) | ||
| Merchandise | Exports | 332.76 | 305.04 |
| Imports | 551.70 | 441.50 | |
| Services* | Exports | 235.81 | 184.65 |
| Imports | 134.99 | 105.45 | |
| Overall Trade (Merchandise+Services) * | Exports | 568.57 | 489.69 |
| Imports | 686.70 | 546.95 | |
| Trade Balance | -118.12 | -57.26 |
Fig 2: Overall Trade during April-December 2022*
MERCHANDISE TRADE
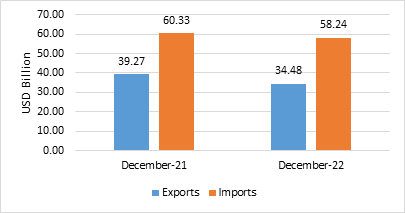
- Merchandise exports in December 2022 were USD 34.48 Billion, as compared to USD 39.27 Billion in December 2021.
- Merchandise imports in December 2022 were USD 58.24 Billion, as compared to USD 60.33 Billion in December 2021.
Fig 3: Merchandise Trade during December 2022
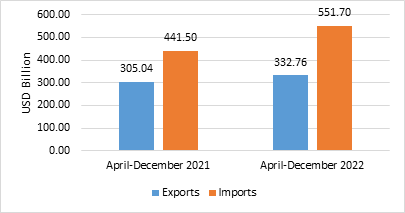
- Merchandise exports for the period April-December 2022 were USD 332.76 Billion as against USD 305.04 Billion during the period April-December 2021.
- Merchandise imports for the period April-December 2022 were USD 551.70 Billion as against USD 441.50 Billion during the period April-December 2021.
- The merchandise trade deficit for April-December 2022 was estimated at USD 218.94 Billion as against USD 136.45 Billion in April-December 2021.
Fig 4: Merchandise Trade during April-December 2022
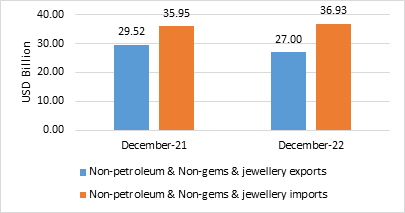
- Non-petroleum and non-gems & jewellery exports in December 2022 were USD 27.00 Billion, compared to USD 29.52 Billion in December 2021.
- Non-petroleum, non-gems & jewellery (gold, silver & precious metals) imports in December 2022 were USD 36.93, compared to USD 35.95 Billion in December 2021.
Table 3: Trade excluding Petroleum and Gems & Jewellery during December 2022
| December 2022(USD Billion) | December 2021(USD Billion) | |
| Non- petroleum exports | 29.54 | 32.52 |
| Non- petroleum imports | 40.77 | 43.84 |
| Non-petroleum & Non Gems & Jewellery exports | 27.00 | 29.52 |
| Non-petroleum & Non Gems & Jewellery imports | 36.93 | 35.95 |
Note: Gems &Jewellery Imports include Gold, Silver & Pearls, precious & Semi-precious stones
Fig 5: Trade excluding Petroleum and Gems & Jewellery during December 2022
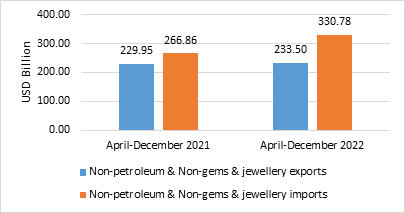
- Non-petroleum and non-gems & jewellery exports during April-December 2022 was USD 233.50 Billion, as compared to USD 229.95 Billion in April-December 2021.
- Non-petroleum, non-gems & jewellery (gold, silver & precious metals) imports were USD 330.78 Billion in April-December 2022 as compared to USD 266.86 Billion in April-December 2021
Table 4: Trade excluding Petroleum and Gems & Jewellery during April-December 2022
| April-December 2022(USD Billion) | April-December 2021(USD Billion) | |
| Non- petroleum exports | 262.49 | 258.86 |
| Non- petroleum imports | 387.80 | 328.94 |
| Non-petroleum & Non Gems & Jewellery exports | 233.50 | 229.95 |
| Non-petroleum & Non Gems & Jewellery imports | 330.78 | 266.86 |
Note: Gems &Jewellery Imports include Gold, Silver & Pearls, precious & Semi-precious stones
Fig 6: Trade excluding Petroleum and Gems & Jewellery during April-December 2022
SERVICES TRADE
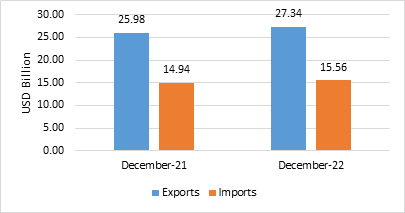
- The estimated value of services export for December 2022* is USD 27.34 Billion, as compared to USD 25.98 Billion in December 2021.
- The estimated value of services import for December 2022* is USD 15.56 Billion as compared to USD 14.94 Billion in December 2021.
Fig 7: Services Trade during December 2022*
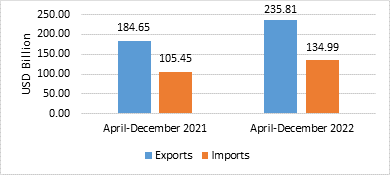
- The estimated value of services export for April-December 2022* is USD 235.81 Billion as compared to USD 184.65 Billion in April-December 2021.
- The estimated value of services imports for April-December 2022* is USD 134.99 Billion as compared to USD 105.45 Billion in April-December 2021.
- The services trade surplus for April-December 2022*is estimated at USD 100.82 Billion as against USD 79.20 Billion in April-December 2021.
Fig 8: Services Trade during April-December 2022*
- The resilient growth of the Indian economy during the first half of the current financial year, the fastest among major economies, bespeaks strengthening macroeconomic stability. However, global growth forecasts indicate downturn in global economic activity and trade. As per Global Composite PMI report (January 2023), new export orders have been contracting for the tenth successive month in December. The report also indicated that India and Ireland were the only nations to register growth of economic activity in December 2022.
- In spite of the high base, highest ever record of exports last year, India’s overall exports (Merchandise and Services combined) in April-December 2022 is estimated to exhibit a positive growth of 16.11 per cent over the same period last year (April-December 2021). December last year has been the second highest monthly export (Merchandise and Services) during 2021-22. As such, due to high base effect, the overall export (Merchandise and Services combined) of USD 61.82 Billion in December 2022 exhibited a negative growth of (-) 5.26 per cent over the same period last year (December 2021).
- India’s merchandise exports exhibited a positive (y-o-y) growth in 11 out of 30 sectors in December as compared to the same period last year and imports have increased in 17 out of 30 sectors (y-o-y). Among the QE commodity groups, Iron Ore (185.76%), Oil Meals (53%), Electronic Goods (36.96%), Other Cereals (16.87%), Tea (15.97%), Rice (13.3%), Tobacco (13.07%), Ceramic Products & Glassware (11.67%), Fruits & Vegetables (8.03%), Cereal Preparations & Miscellaneous Processed Items (4.9%), RMG Of All Textiles (1.02%), registered positive growth (y-o-y) in December 2022.
- The exports of Electronic goods during the period April – December 2022 recorded USD 16.67 billion as compared to USD 10.99 billion during the same period last year registering a growth of 51.56%. Exports of petroleum products in April – December 2022 was USD 70.28 billion registering a growth of 52.15% over USD 46.19 billion in April – December 2021. More than USD 6 Billion worth of Smartphones were exported during the period April-November 2022.
- In the Textile sector, Cotton yarns exports declined because there was continuous price rise of raw materials throughout 2022. Exports of Indian Textile apparels and RMG textiles got a major hit due to recessionary trend in major economies.
- Given the cumulative growth until December 2022 and the indicators of the slowdown in global economic activity, there is cautious optimism on international trade in the last quarter of the current financial year.